
Filtering analytics: date ranges, funnel, campaign, currency
A behavior-accurate guide to the four Analytics filters, every date preset, and how the filters reset and combine with one another.
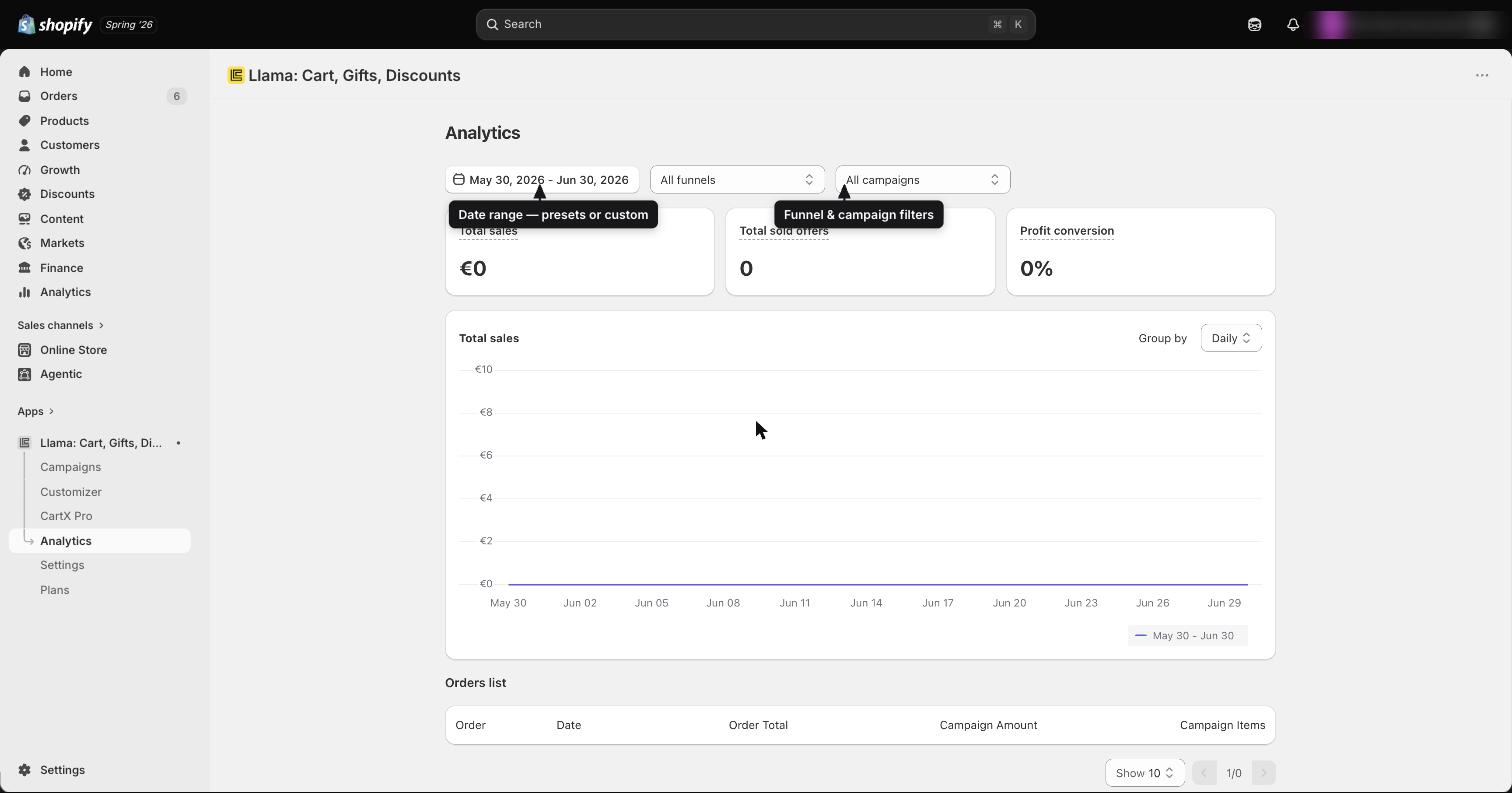
The Analytics page has four filters across the top: a date range picker, and three dropdowns for currency, funnel, and campaign. Together they decide which slice of your campaign revenue the metric cards and the sales chart show. This page documents each filter precisely — every preset and its exact meaning, the rules for how one filter resets another, and the one part of the page that ignores filters entirely.
If you want a plain-English definition of the numbers themselves, see the metrics reference. For how a sale becomes campaign revenue in the first place, see how revenue is attributed.
The date range
The leftmost control is a button labelled with the currently selected range, formatted as MMM DD, YYYY - MMM DD, YYYY (for example, May 28, 2026 - Jun 26, 2026). Click it to open a popover with a preset list on the left and a calendar on the right.
When you pick a preset, the calendar updates to preview it. Nothing is applied to the page until you press Apply — see Applying or cancelling below.
Every preset, exactly
The default range when the page first loads is Last 30 days. Here is what each preset means down to the hour.
| Preset | Start of range | End of range |
|---|---|---|
| Today | The start of today in your shop's timezone (00:00) | Right now |
| Last 24 hours | Now minus 1 day | Right now |
| Last 7 days | Now minus 7 days | Right now |
| Last 30 days (default) | Now minus 30 days | Right now |
| Last 90 days | Now minus 90 days | Right now |
| Last 365 days | Now minus 365 days | Right now |
| All the time | Your first recorded metric or order date | Your most recent order date |
The "Last N days" presets are rolling windows measured from the current moment, not calendar days. "Last 7 days" means now minus 7 × 24 hours, so at 3 PM it starts at 3 PM seven days ago — not at midnight. The only preset that snaps to the start of a day is Today, which begins at 00:00 in your shop's timezone. If you need clean calendar boundaries (for example, the 1st to the 30th of a month), use a custom range instead.
A few details worth knowing:
- Today always begins at midnight in your shop's timezone, matching how days are bucketed in your Shopify reports and on the sales chart. Every other "Last N days" preset starts from the exact current time of day.
- All the time is special. Its start is the earliest date the app has any data for — the date of your first recorded daily metric, or, if that is missing, your first ever tracked order. Its end is the date of your most recent order. Because the bounds come from your real history, "All the time" can differ from store to store.
Custom ranges on the calendar
To the right of the preset list is a calendar that shows two months at once and lets you select a start and end date by clicking the two ends of the range.
Open the picker
Click the date-range button to open the popover.
Navigate to the months you need
Use the calendar's month arrows to move between months. The calendar shows two months side by side so you can span a month boundary without flipping back and forth.
Click the start date, then the end date
Click the first day of your range, then the last day. The days in between highlight to show the selection.
Apply
Press Apply to load the metrics for that range.
Future dates are disabled. Any date after today is greyed out and cannot be selected — Analytics only has data up to the present moment, so a range that ends in the future would simply have no data past today.
Selecting a custom range on the calendar overrides whichever preset was highlighted. The button label then reflects the two dates you picked.
Applying or cancelling a range
At the bottom of the popover are two buttons:
| Button | Effect |
|---|---|
| Apply | Commits the selected range. The metric cards and chart reload for the new range and the popover closes. |
| Cancel | Closes the popover with no change. Anything you picked since opening it is discarded and the previously applied range stays in effect. |
Choosing a preset or clicking calendar dates does not change your reports on its own — it only updates the preview inside the popover. You must press Apply for the page to reload. If you close the popover any other way, your pick is dropped.
The funnel filter
The first of the three dropdowns narrows every figure to a single campaign type (called a "funnel"). Its options are:
| Option | What it shows |
|---|---|
| All funnels (default) | Every campaign type combined |
| Pre-purchase | Product Recommendations offers |
| Auto-add | Auto Add Product offers |
| Post-purchase | Post Purchase offers |
| Gift with purchase | Gift with Purchase offers |
| Unlock | Unlock offers — only visible on specific stores |
The Unlock option appears only for a small set of stores that use the Unlock funnel. If you don't see Unlock in your funnel dropdown, your store doesn't have it — that's expected and nothing is missing.
See the Campaigns guide for what each campaign type does on your storefront.
Changing the funnel resets the campaign filter to "All campaigns." Because the list of campaigns you can pick depends on the funnel (see below), the app clears any selected campaign whenever you switch funnels, so you never end up filtered to a campaign that doesn't belong to the chosen funnel. If you had drilled into one campaign and then change the funnel, you'll be looking at the whole funnel again.
The campaign filter
The third dropdown narrows the figures to a single campaign. Its behavior depends on two things: which campaigns exist, and which funnel you've selected.
- Draft campaigns are never listed. Only campaigns that are Active or Inactive (anything that isn't a draft) appear, because drafts have never run and have no analytics.
- The list respects the funnel. If you've chosen a funnel, only campaigns of that type appear. With All funnels selected, every non-draft campaign is listed.
- All campaigns (the default, empty selection) shows the combined figures across whatever the funnel filter currently allows.
The "(Deleted campaigns)" option
At the very bottom of the campaign list you may see a special (Deleted campaigns) entry. Selecting it shows the combined figures for campaigns that no longer exist — analytics data is preserved even after you delete a campaign, and this option is the only way to see it. It rolls every deleted campaign's revenue into one set of numbers; it does not break them out campaign by campaign.
(Deleted campaigns) only appears when no funnel is selected. It is shown in the campaign dropdown only while the funnel filter is on All funnels. The moment you pick a specific funnel, the option disappears — so to audit deleted-campaign revenue you must first set the funnel back to All funnels.
The currency filter
If your store has recorded campaign sales in more than one currency, a currency dropdown appears as the first of the three dropdowns. If everything was recorded in a single currency, the dropdown is hidden entirely — there's nothing to switch between.
- The default selection is your shop's primary currency (the currency configured in Shopify).
- Each currency is tracked separately, and amounts are never converted between currencies. The figure you see is the raw total in the selected currency only.
- Switching currency reloads the metric cards and chart for that currency.
Because currencies are separate ledgers, the totals for, say, USD and EUR will not add up to a single "grand total." Switch the currency filter to read each one on its own.
How the filters interact
The four filters layer on top of each other, but some combinations reset others. This matrix summarizes the rules.
| Action | Date range | Currency | Funnel | Campaign |
|---|---|---|---|---|
| Change date range | — | unchanged | unchanged | unchanged |
| Change currency | unchanged | — | unchanged | unchanged |
| Change funnel | unchanged | unchanged | — | reset to All |
| Change campaign | unchanged | unchanged | unchanged | — |
Key takeaways:
- Date range, currency, funnel, and campaign all combine. You can view, for example, Post-purchase, in EUR, over the last 90 days all at once.
- Only the funnel resets another filter — it clears the campaign back to "All campaigns." No other filter resets anything.
- Picking a specific campaign makes the funnel filter redundant, because a campaign already belongs to exactly one funnel. The campaign selection is the most specific filter you can apply.
The one thing filters don't touch: the orders list
The metric cards and the sales chart respond to all four filters. The orders list below them does not — it always shows every tracked order for your store, newest first, paginated, no matter what date range, currency, funnel, or campaign you've selected. Don't expect the orders list to shrink when you narrow a filter; it won't. Use the metric cards and chart to read filtered totals, and treat the orders list as a complete, unfiltered ledger of tracked orders.
This is intentional: the orders list is a full audit trail, while the cards and chart are the analytical view you slice with filters.
Recipes
Edge cases and troubleshooting
Related pages
Reading the sales chart and the orders list
How the Total sales chart and the Orders list work — what they plot, how to group and page through them, and the edge cases to watch.
Why your Analytics totals differ from Shopify reports
A line-by-line reconciliation of Llama Analytics against Shopify reports — what each number measures and why they will never match exactly.