
Analytics overview
See how much revenue your campaigns generate — sales, sold offers, conversion rate, and the orders your offers helped create.
The Analytics page shows how much revenue your campaigns generate. It tracks every order that includes a product sold through one of your offers and breaks the results down into three headline metrics, a sales chart over time, and a list of the individual orders behind the numbers.
Only orders that contain at least one campaign product appear in Analytics. Orders where no offer was taken are not tracked, so every figure you see is revenue your campaigns directly contributed to.
This page is a tour of what's on the screen. Use the Go deeper cards at the bottom to jump to the full reference for any part you want to understand precisely — exact formulas, how attribution works, and why your totals won't match Shopify.
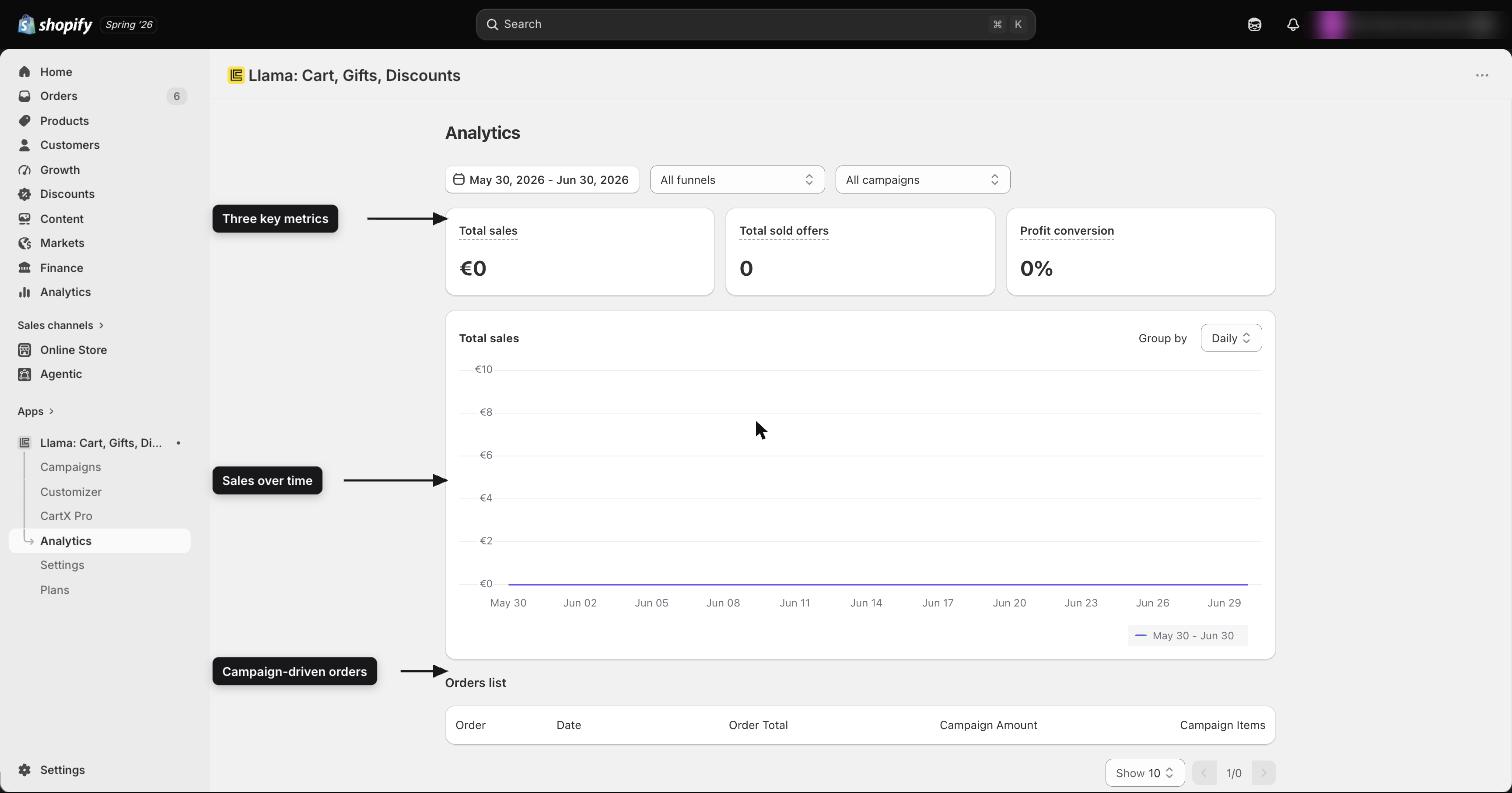
What each metric means
Three metric cards sit at the top of the page.
Total sales
The revenue from products sold through your campaigns, in the selected currency and date range. This counts only the offered products themselves — not the rest of the order, and not income from other shop products.
For items bought when the order is placed, amounts are recorded after discounts, so they reflect what shoppers actually paid. Items accepted through a post-purchase offer are recorded at their listed price.
Total sold offers
The total number of units sold through your campaign offers in the selected range. This tells you how many offered products shoppers actually purchased.
Profit conversion
Despite the name, this is not a profit margin — no costs are subtracted. It's the share of tracked order value that came from your offers: Total sales divided by the combined subtotal of all tracked orders, shown as a percentage rounded to one decimal place. It answers a simple question: of the order value your campaigns touched, how much came directly from your offers?
"Profit conversion" is a ratio, not a margin. See the Glossary for the exact formula and the precise definition of each input.
All metrics are gross. Refunds, cancellations, and returns are not subtracted after the fact, so a refunded order still counts toward Total sales. See Data freshness, timezones & currencies for what is and isn't reflected.
The sales chart
The chart plots Total sales over the selected date range.
- Use Group by to switch between a daily and a monthly view.
- Hover over any point to see the exact amount for that day.
Days are bucketed using your store's timezone, so the chart lines up with how you read your Shopify reports.
For the full breakdown of how the chart and orders list read, see The chart & orders list.
Filters
The three metric cards and the sales chart respect the filters at the top of the page.
Date range
Pick a preset — Today, Last 24 hours, Last 7 days, Last 30 days, Last 90 days, Last 365 days, or All the time — or select a custom range on the calendar. The default view is the last 30 days.
Currency
If your store has recorded orders in more than one currency, choose which currency to view. Each currency is tracked separately, and amounts are never converted between currencies.
Funnel
Narrow the figures to a single campaign type — for example, only Post Purchase or only Gift with Purchase. See Campaigns for what each type does.
Campaign
Narrow the figures to one specific campaign. Draft campaigns are not listed. A special (Deleted campaigns) option shows the combined figures of campaigns you have since deleted — analytics data is kept even after a campaign is removed.
The orders list is not affected by these filters. It always shows all tracked orders for your store, newest first — regardless of the selected date range, currency, funnel, or campaign.
For each filter's exact behavior and how they combine, see Filtering analytics.
The orders list
Below the chart, the orders list shows every tracked order, newest first.
| Column | What it shows |
|---|---|
| Order | The Shopify order number |
| Date | When the order was placed |
| Order Total | The order's subtotal |
| Campaign Amount | The portion of the order that came from your campaign offers |
| Campaign Items | The campaign product lines included in the order |
Each row links directly to the order in your Shopify admin. You can show 10, 25, or 50 orders per page.
How revenue is attributed
When a shopper takes one of your offers, the app tags that cart line so it can recognize it later. When the order is placed, the app records the offered items' quantity and paid price under the matching campaign — never the products the shopper added on their own.
For the full mechanism, including how post-purchase offers and discounts are handled, see How revenue is attributed.
Plan availability
The full Analytics page — metric cards, sales chart, filters, and the orders list — is available on every plan. The current plan lineup lists analytics as follows.
| Plan | Analytics |
|---|---|
| Free | Basic Analytics |
| Starter | Analytics |
| Growth | Advanced Analytics |
| Pro | Advanced Analytics |
| Enterprise | Advanced Analytics (everything in Pro) |
See Settings and Billing for plan prices and the limits that apply to other features.
Go deeper
These pages cover the analytics screen in depth — exact definitions, the attribution mechanism, and the reasons your numbers behave the way they do.
Glossary of metrics
Every metric and column defined precisely — Total sales, Total sold offers, Profit conversion (a ratio, not a margin), Order Total, and Campaign Amount — with the exact formula behind each.
How revenue is attributed
How the app tags offered items, records them at order time, and handles post-purchase offers and discounts so only offered items count.
Why my numbers differ from Shopify
Why Analytics totals never match your full Shopify sales — offered items only, gross figures, per-currency tracking, and timezone bucketing.
Filtering analytics
Each filter — date range, currency, funnel, campaign — what it changes, how they combine, and why the orders list ignores all of them.
The chart & orders list
How the sales chart buckets and plots Total sales, the Group by views, and how to read every column of the orders list.
Data freshness, timezones & currencies
When new orders appear, why figures are gross (no refunds subtracted), how days are bucketed by store timezone, and why amounts are split per currency.
Frequently asked questions
Translate widget & cart text per locale and market
Localize every shopper-facing Llama Upsells string — Llama Cart, widgets, GWP, post-purchase, checkout — per language and per market with Translate & Adapt.
Metrics reference: every number defined
A precise glossary of every metric, column, and field on the Analytics page — with exact definitions, formulas, and units.